Introduction
A/B testing is the gold standard for making data-driven decisions in product development and marketing. However, a common pitfall in the business world is “peeking”—checking results too early and stopping a test as soon as it looks significant. This leads to false positives and decisions based on noise rather than signal.
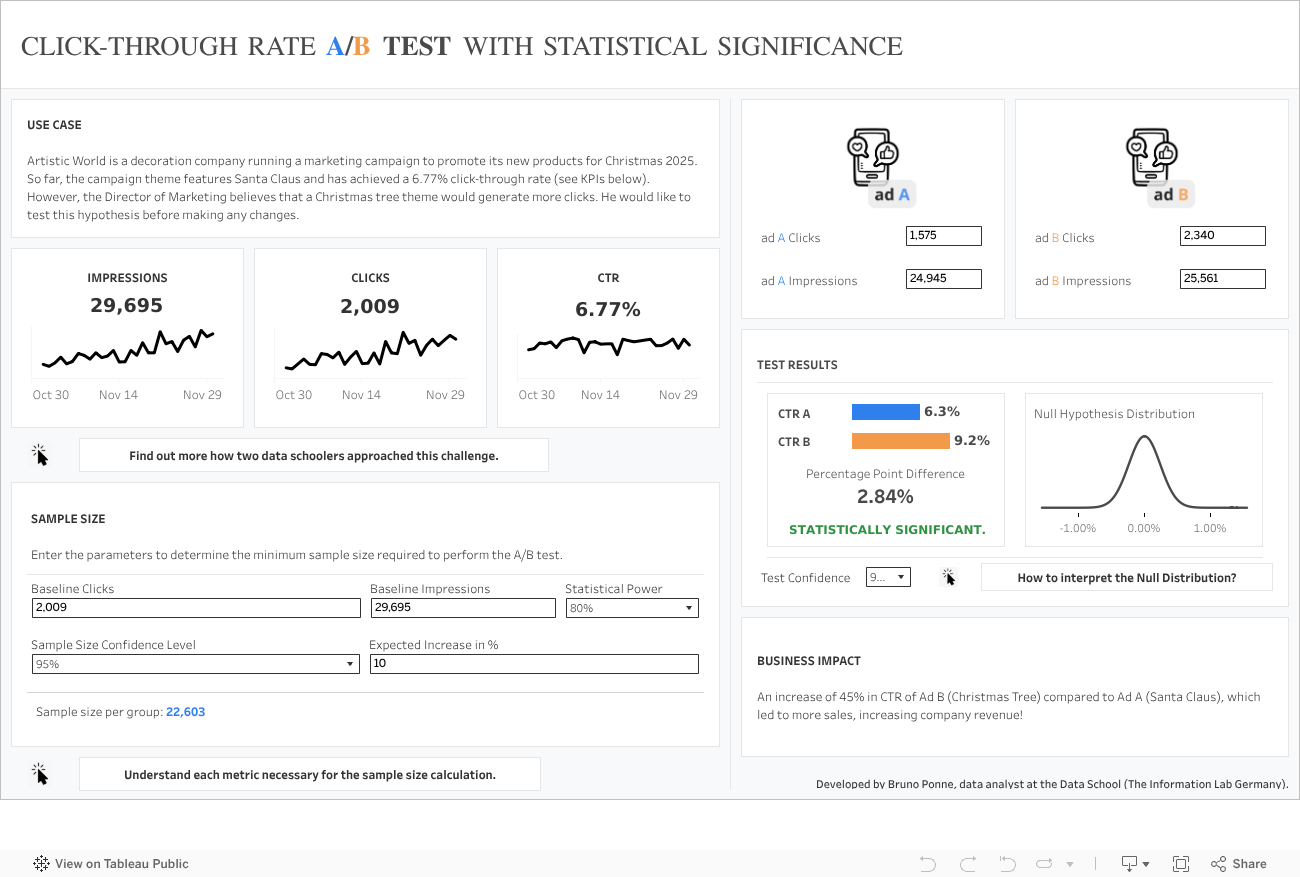
To address this, I developed a Tableau Public Dashboard that not only tracks the performance of control vs. treatment groups but also rigorously calculates Statistical Significance and Minimum Sample Size natively within Tableau.
Methodology
Unlike many Tableau solutions that rely on external R or Python scripts, this dashboard performs all statistical calculations using native Tableau Calculated Fields. This ensures the dashboard is fast, portable, and easy to maintain.
1. Sample Size Calculation
Before analyzing the results, it is crucial to determine how much data is needed. If you stop a test before reaching this threshold, your results may not be reliable. I implemented the sample size formula for two independent proportions based on the methodology from Select Statistical Consultants.
The formula requires:
- Significance Level: Typically 5% (95% confidence).
- Power: Typically 80%.
- Baseline Conversion Rate: The current performance of the control group.
- Minimum Detectable Effect (MDE): The smallest improvement you want to be able to detect.
The dashboard dynamically calculates the required n (sample size per group) to ensure the test has enough power to detect the MDE.
2. Statistical Significance (Z-Test)
To determine if the difference between the Control (A) and Treatment (B) groups is real, I employed a Z-test for Two Independent Proportions.
Following the statistical framework from Penn State University, the dashboard calculates:
- Pooled Proportion: A weighted average of the proportions from both groups.
- Standard Error: Calculated using the pooled proportion.
- Z-Score: The number of standard deviations the result is from the null hypothesis (no difference).
If the Z-Score exceeds the critical value (e.g., 1.96 for 95% confidence) the dashboard flags the result as statistically significant.
Advantages Over Other Approaches
While resources like Playfair Data’s Guide offer excellent introductions to Z-tests in Tableau, my approach adds critical safeguards for business users:
- Minimum Sample Size Guardrails: Most dashboards show significance (p < 0.05) even when sample sizes are too small, leading to premature conclusions. My dashboard explicitly visualizes the “Minimum Sample Size” line, warning users if the test is not yet mature.
- Native Implementation: By avoiding Python/R integrations, this solution works seamlessly on Tableau Public and requires no complex server-side configuration.
- Advanced Configuration: Users can adjust parameters like Confidence Level and MDE directly in the UI to see how they impact the required sample size and significance.
Business Value
For businesses, this tool bridges the gap between raw data and statistical rigor. It provides accurate A/B testing by:
- Reducing Risk: Prevents rolling out “winning” features that are actually neutral or harmful.
- Saving Time: Automates complex calculations that analysts usually perform manually in Excel or R.
- Standardizing Decisions: Provides a consistent framework for evaluating experiments across the organization.